Full-size map It’s the 2016 primary election season in the United States and this map represen
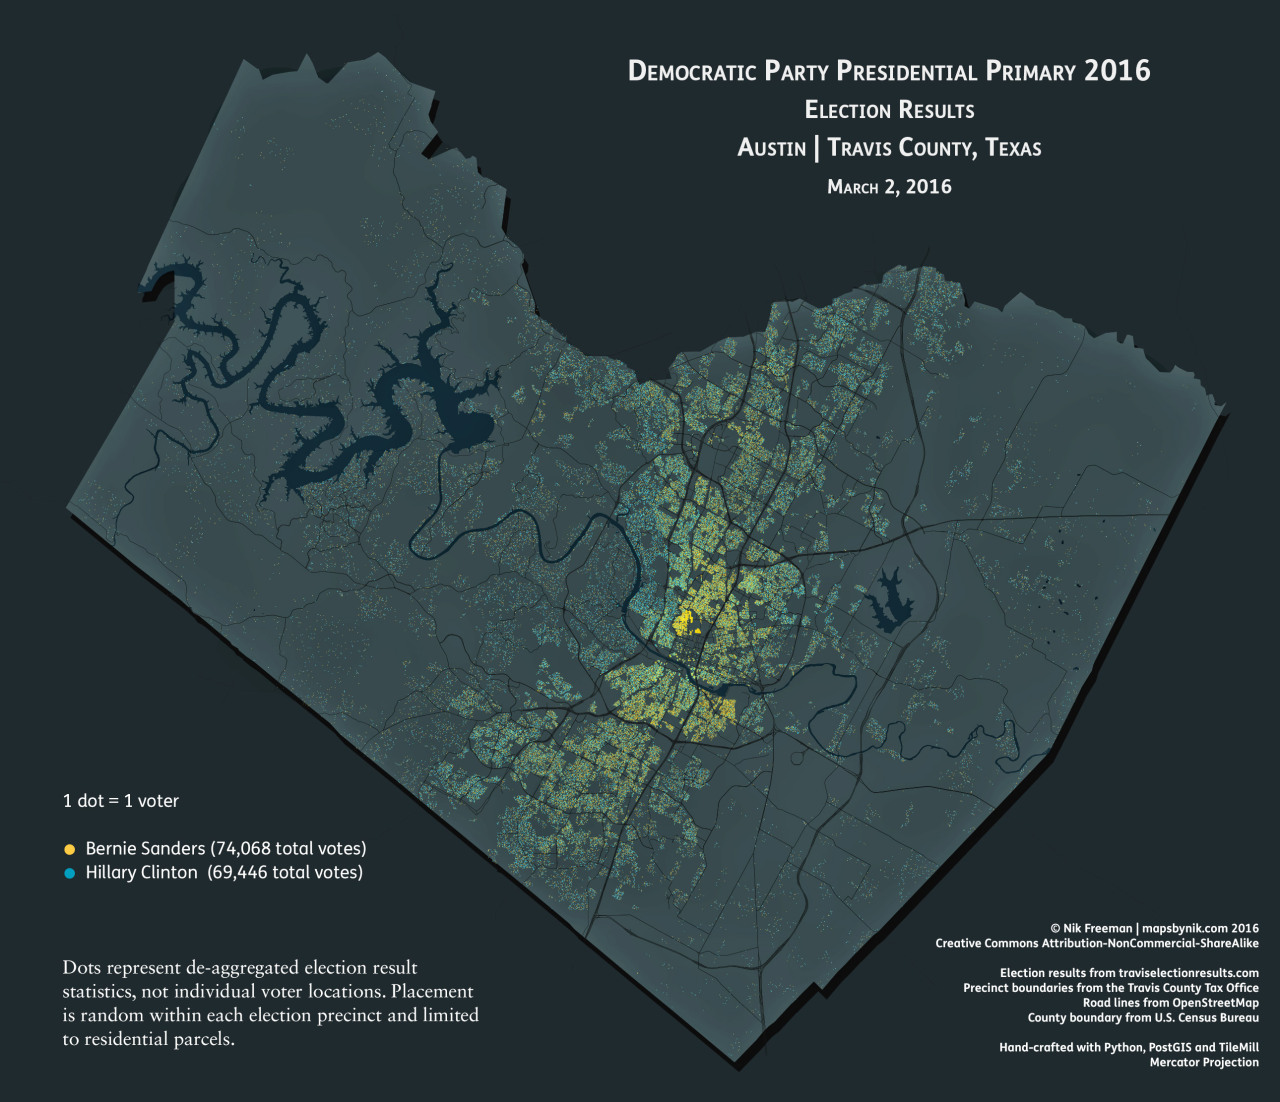
Full-size map It’s the 2016 primary election season in the United States and this map represents a small part of it. It depicts the geographic distribution of votes for Hillary Clinton and Bernie Sanders in Travis County, Texas (home to Austin, the state’s capital city) during the Democratic Presidential Party on “Super Tuesday”, March 2. The dots on the map represent voters. They were generated from the precinct-level election returns published by the Travis County Clerk’s office. Yellow dots represent votes for Sanders, while turquoise dots represent votes for Clinton. To give a sense of where groups of supporters live, the dots are constrained to cadastral parcels zoned for residential use. Dots are drawn randomly within each precinct and parcels; they do not represent the locations of individual voters. Despite losing the state, Sanders won the county by about 4600 vote. Not a great surprise, given the county’s left-leaning reputation. Some general observations: Clinton actually won more precincts, 130 to 109. But those wins were of smaller magnitude compared to Sanders’. Clinton’s precincts were won by an average of 78 votes while Sanders averaged nearly double the margin with 142 votes per precinct. Geographically, Sanders showed extremely strong support in downtown neighborhoods, especially at UT–Austin and its surroundings. In the precinct housing most of the dorms, Sanders ran up a huge 5.5X, +1419 vote win. Impressive margins for Sanders were also found in the West University (+924), Pleasant Valley (+759) and Parker Lane (+622) neighborhoods. Clinton scored the most lopsided victory, 52 to 8 (6.5X margin), in Webberville in the southeast portion of the county. Clinton’s strongest areas of support came from the neighborhoods along RM 2222 west of Mopac, and on both sides of the river, scoring a handful of solid +200 to +300 vote victories. Additional strong showings were found at the Circle C Ranch developments in the southwest of the county and the Pecan Springs Springdale neighborhood in eastern Austin. :: Election maps are always fun and I enjoyed putting this one together. The use of parcel data to limit the geographic extent of the symbology was a bit of an experiment for me. I think the results turned out well, revealing more detailed patterns among the candidate’s supporters than would have been revealed otherwise. P.s. - For the curious: yes, I did look at the Republican Primary results as well. They weren’t that geographically interesting though, so I’m not likely to publish a map about it. © Nik Freeman | mapsbynik.com 2016 Creative Commons Attribution-NonCommercial-ShareAlike Election results from traviselectionresults.com Precinct boundaries from the Travis County Tax Office Parcel boundaries from Travis Central Appraisal District Road lines from OpenStreetMap County boundary from U.S. Census Bureau Hand-crafted using Python, PostGIS and TileMill Mercator Projection -- source link
Tumblr Blog : tumblr.mapsbynik.com
#austin#travis county#election#sanders#clinton#voters#president#primary#austinography
