Powerball is an extremely popular national lottery game,often making headlines with nine-figure jack
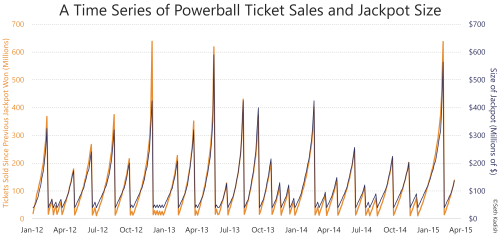
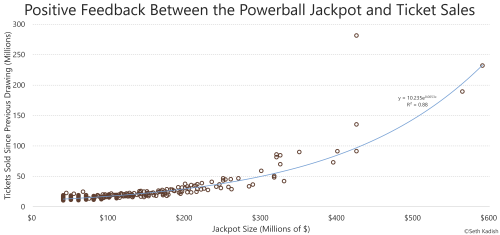
Powerball is an extremely popular national lottery game,often making headlines with nine-figure jackpots. The minimum jackpot is $40 million, which then increases in size based on ticket sales; it is estimated to be just under one third (32.5%) of the revenue from the base plays, which exclude the Power Play. If no one wins the jackpot, the prize carries over to the next drawing. Drawings occur every Wednesday and Saturday. In this post, I’ve derived the relative interest in the game by state, and graphed the relationship between ticket sales and jackpot size.Currently, 44 states participate (plus DC, PR, and VI). Using more than two years of historical data, I calculated the average number of tickets sold per 1000 state residents on a daily basis. The averages range from 11.5 (WA) to 39.9 (RI). The top three are RI, DE (39.0), and NH (36.5). The bottom three are WA, TX (12.6), and AR (14.2).The time series shows the frequency of jackpots won, and hints at the rate of sales growth relative to jackpot size. The scatter plot shows this relationship more clearly. As the jackpot increases, more people notice and/or people who regularly purchase ticket buy even more of them. This has positive feedback, resulting in exponential growth. The outlier on the scatter plot is from November 25th to 28th, 2012. At $425 million, it was the largest Powerball jackpot in the history of the game. More than 280 million tickets were sold during those four days. The California Lottery Commission voted to join Powerball the next day, and began participating the following April. Data sources: http://www.lottoreport.com/ and http://www.powerball.com/pb_home.asp -- source link
Tumblr Blog : vizual-statistix.tumblr.com
#powerball#lottery#powerball lottery#fortune#gamble#gambling#wealth#wealthy#millionaire#winner#graphs#data visualization#dataviz#infographics


