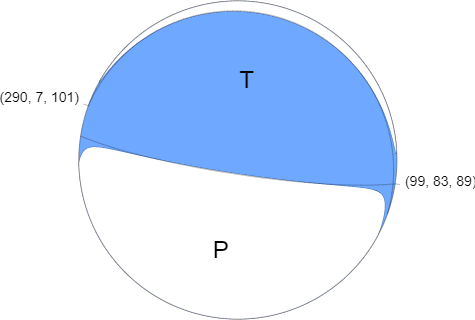
How do we know what kind of fault an earthquake happens on?This image shows data from the earthquake
How do we know what kind of fault an earthquake happens on?This image shows data from the earthquake in Nepal a few years ago. This quake happened on a thrust fault - a shallowly dipping fault in the crust, where the rocks are being squeezed together. From reading data in a plot like this one after basically every major earthquake geologists around the world can describe the type of fault that caused this earthquake and explain how it fits with the other tectonic features in the area. How do we actually do that? How does this image tell me it was a thrust fault rather than a normal fault? This post will explain it.We can tell what kind of fault hosted an earthquake and even the angle of the fault using a plot like this, called a moment tensor plot, a focal mechanism plot, or a “beachball plot” for obvious reasons.At the instant an earthquake occurs, there is a pressure change; the rocks that were squeezed together in the fault suddenly feel less pressure while the surrounding rocks suddenly feel more. You can even simulate this effect using your hands: if you squeeze them together and slide them past each other, simulating an earthquake, when your hands move some areas move forward and would be put into compression, other areas feel a pressure release. If you change the angle of the fault by twisting your hands, you change the pattern of which rocks at the surface feel compression and which feel extension.This pattern of rocks that are squeezed or decompressed can actually be recorded. Seismometers near the quake will detect whether the first wave to reach them shows compression or extension and that data is enough to reconstruct the fault motion.This beachball plot shows that data in a 360-degree projection where each curve represents an angle relative to the surface – curves near the edge represent planes at shallow angles. The area shown in blue represents seismometers that saw compression in this event, the area shown in white represents areas that extended. When we see a pattern like this, with compression at the center surrounded by extension on the sides and a low angle between the boundaries and the surface, we can tell that the quake happened on a thrust fault.If we see instead a beach ball that is split into 4 quadrants, like a pie chart, that’s a signal of a strike slip fault. Finally, if the area that is compressed is at the edges of the plot, we can tell that’s a normal fault, formed in an extensional environment.Beachball plots are one of geology’s many tools for interpreting earthquake data; a handful of seismic stations feeding data into a system can be enough to reconstruct the strike and dip of a fault in addition to how the fault moved in a quake within only a couple hours. The fault that broke in Nepal is one of the low-angle thrust faults produced by the collision of India and Eurasia, in this case a fault with a dip of 11° relative to Earth’s surface.-JBBImage credit: USGShttp://on.doi.gov/1PB5h9ZRead more:http://bit.ly/1DKMT6ihttp://www1.gly.bris.ac.uk/~george/focmec.htmlhttp://demonstrations.wolfram.com/EarthquakeFocalMechanism/ -- source link
Tumblr Blog : the-earth-story.com
#science#earthquake#fault#geophysics#thrust fault#geology#research#beachball
